The 2026 RoverPass
Outdoor Hospitality Report
Camping, RVing, and Beyond in the United States
The 2025 US Outdoor Hospitality Industry, By the Numbers
For the first time in RoverPass platform history, total reservations declined while revenue hit an all-time high. Cancellation rates fell to a record low. Glamping surged 43.6%. Long-term stays grew 19%. We call this convergence The Quality Shift.
Methodology: Every figure reflects real booking activity on the RoverPass platform throughout calendar year 2025 (Jan 1 – Dec 31). No surveys, no projections, no third-party estimates. See full methodology →
The Team Behind This Report
RoverPass is the leading campground management and reservation platform in the United States, powering hundreds of parks from coast to coast.
Since 2014, RoverPass has helped campground and RV park operators modernize their businesses with an all-in-one platform for reservations, payments, channel distribution, and operations management.
This report is built entirely from first-party transaction data — real reservations, real payments, real guest activity across the RoverPass network. No surveys. No estimates. No third-party projections.
Our goal is to give operators, investors, and industry leaders the clearest possible picture of where outdoor hospitality stands today — and where it's heading next.
Inside This Report
- The Big Picture — Executive summary & 2025 headline metrics
- The Campers — Guest composition, accommodation types & glamping spotlight
- How They Book — Booking channels, OTA landscape & payment methods
- Cancellations & Rebooking — Record-low cancellation rates & timing
- The Money — Revenue records, nightly rates & the quality shift divergence
- When & Where — Seasonality, regional map & long-term stays
- Looking Ahead — Eight trends to watch in 2026
The Industry's Most Comprehensive Look at American Outdoor Hospitality
You are reading the most detailed portrait of the American campground economy published this year. The 2026 RoverPass Outdoor Hospitality Report draws on hundreds of real reservations across hundreds of campgrounds, representing tens of millions of dollars in tracked revenue during the 2025 calendar year.
Every number in these pages comes from actual transactions — real travelers booking real stays at real properties — not surveys, not projections, not sentiment polls.
This year's report arrives at an inflection point. After several years of pandemic-fueled growth and subsequent normalization, 2025 revealed something more interesting than another growth headline: a fundamental change in what outdoor hospitality means to the American traveler.
"Travelers did not stop camping in 2025 — they started camping differently."
Methodology
- Source: First-party RoverPass transaction data
- Period: Jan 1 – Dec 31, 2025 vs. 2024
- Scope: Hundreds of active parks using RoverPass
- Revenue: Tens of millions tracked (all-time high)
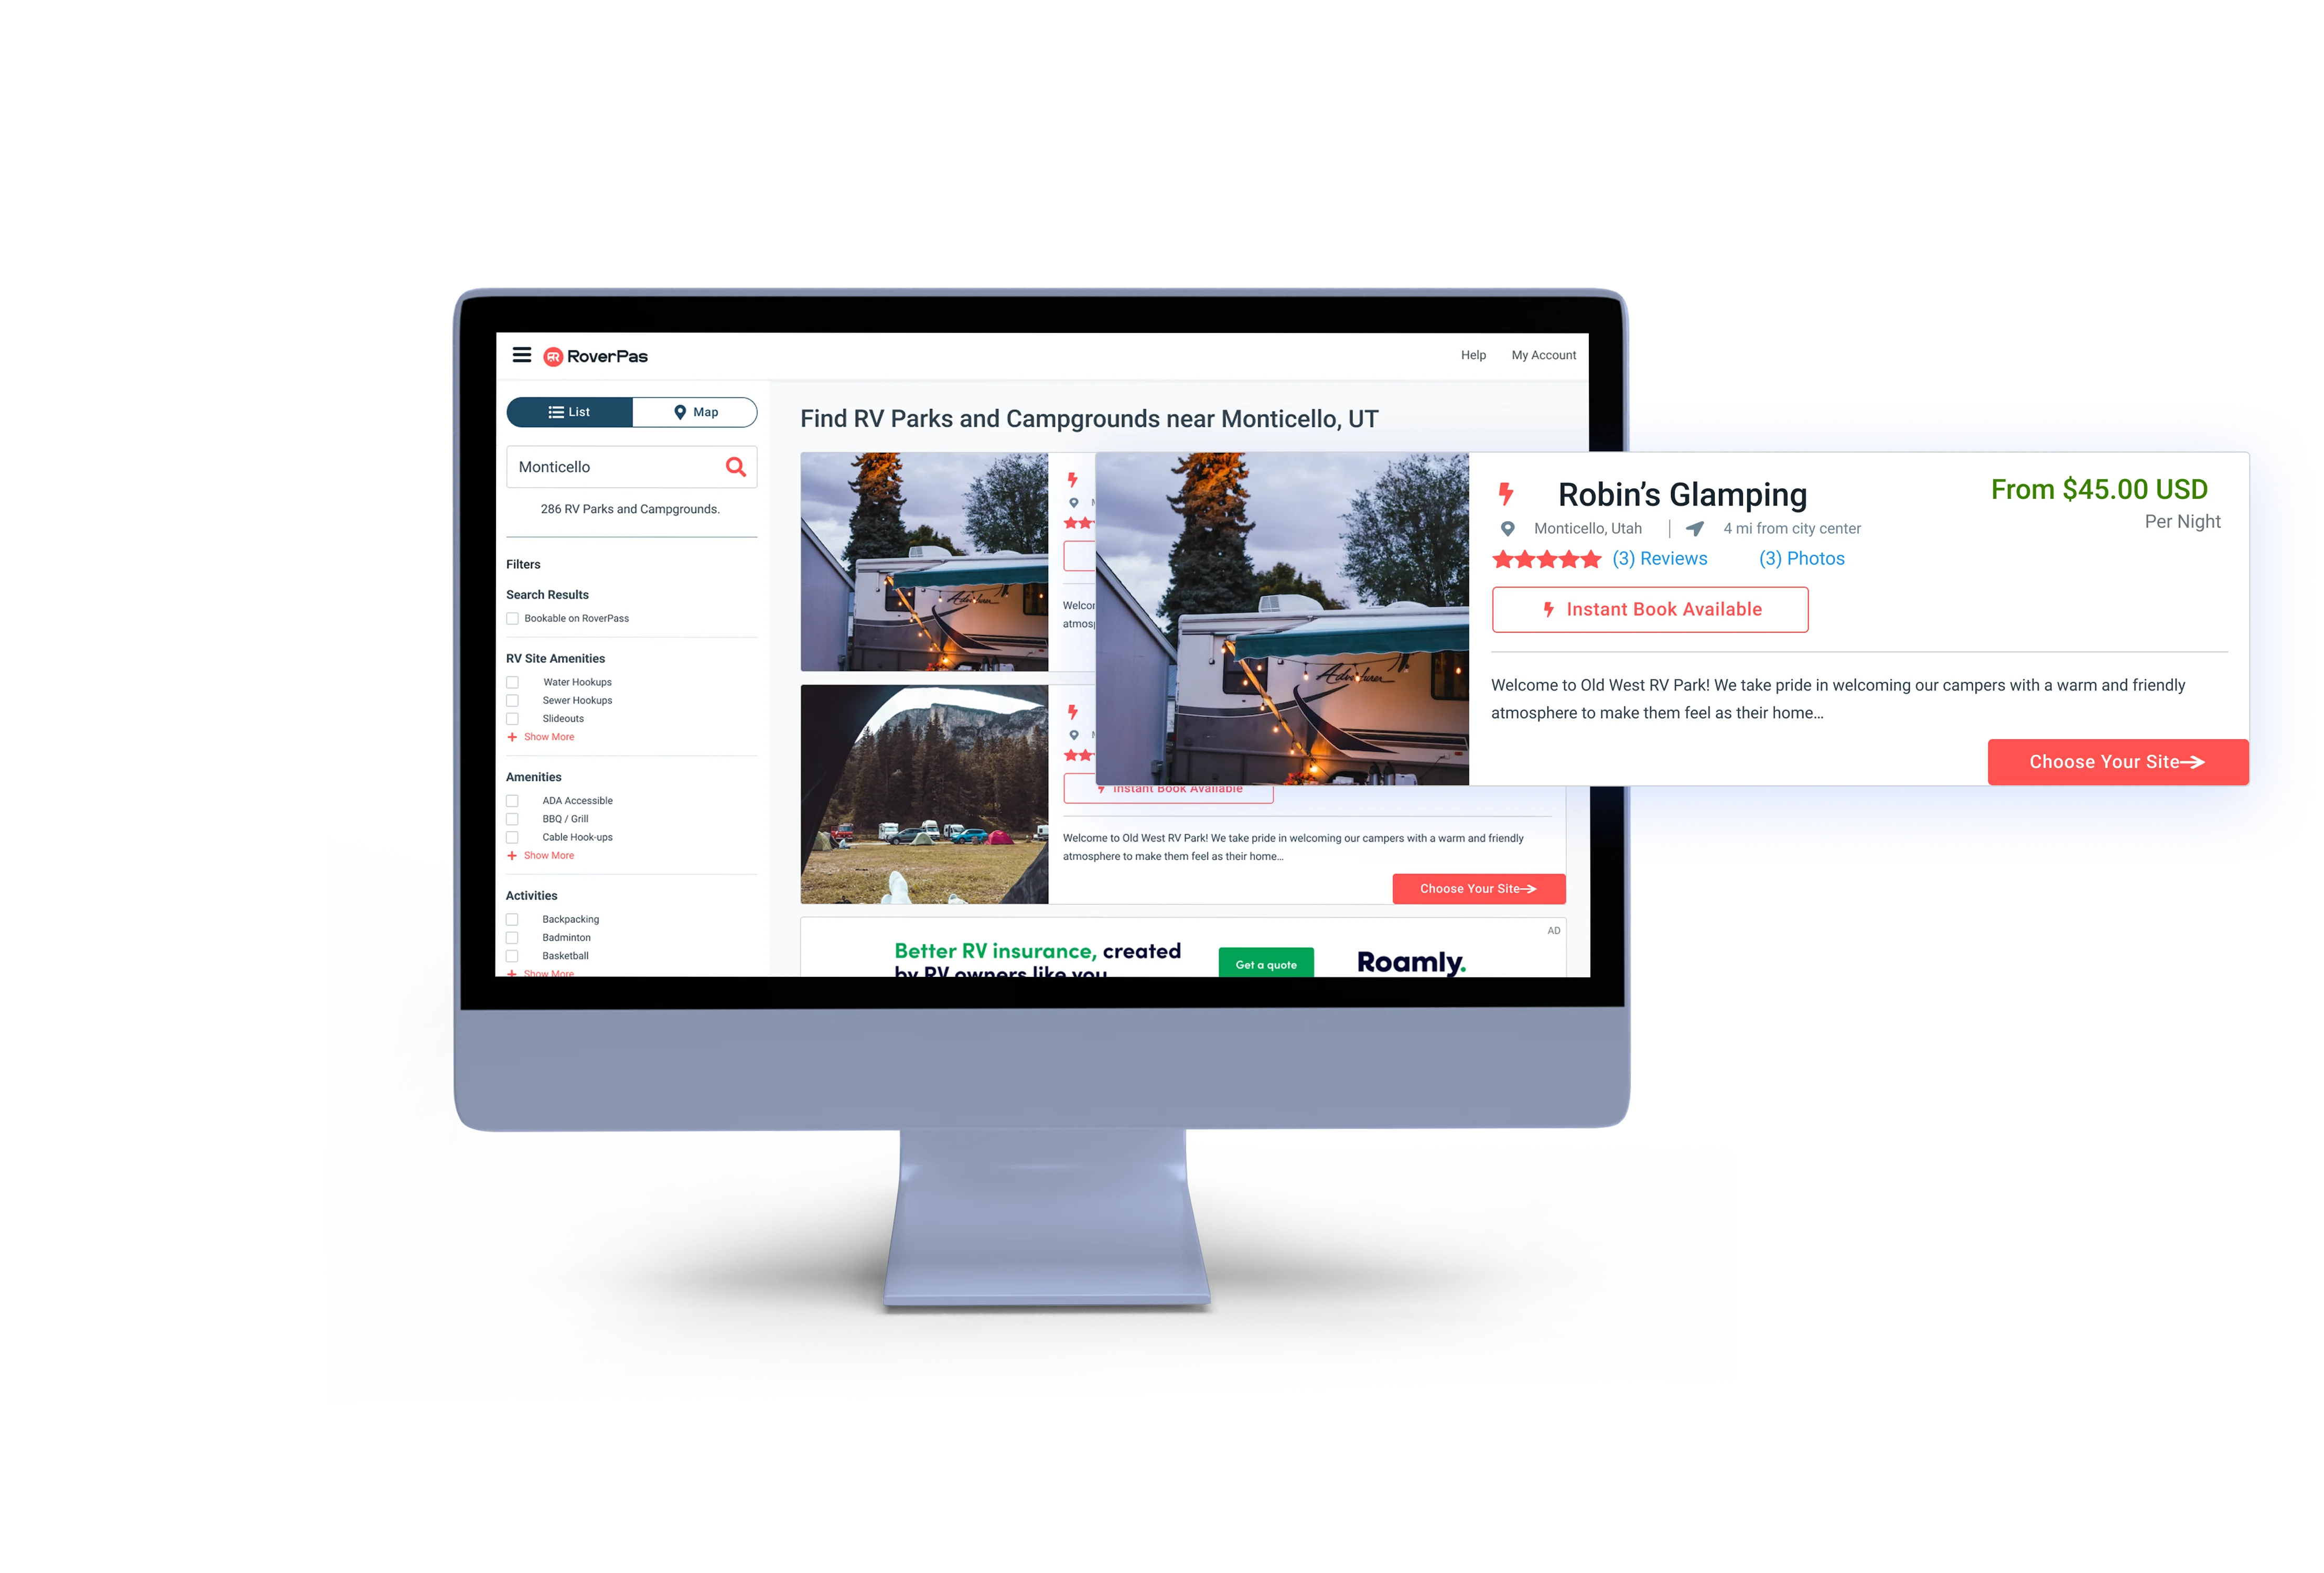
Get found.
Get booked.
Millions of travelers search RoverPass every month. Put your park in front of guests who are ready to reserve — right now.

The Year the Industry Grew Up
Fewer reservations. More revenue. Better guests. Lower cancellations. The outdoor hospitality industry didn't just grow in 2025 — it matured.
"Revenue climbed 5.2% to an all-time high — while total reservations declined for the first time in platform history. The math is clear: each booking became more valuable."


Every tool.
One plan.
Connect OTAs, automate with Zapier, sync QuickBooks, manage gate access — all tools included at a flat rate.
Not per integration. Not per partner. One flat price.
The Campground Is Changing — And Getting Younger Again
Despite a modest dip in adult attendance, a quiet trend reversal is underway: children are returning to the outdoors.
Adult campers declined 3.7% year over year, tracking closely with the broader reservation dip. This is not a cause for alarm — it reflects a post-pandemic normalization where casual, one-time campers have cycled out, leaving a more intentional guest base behind.
The real story is happening in the under-18 cohort. Children's attendance rose 1.3% year over year, reversing a multi-year decline. Kids are coming back. Families who stepped away are returning, and operators who invested in family-friendly amenities are seeing those investments pay off.
Guest Composition
How the average campground visit breaks down by traveler type
What Campers Prefer
RV Still Reigns — But the Mix Is Starting to Move
Share of total bookings by site type — 2024 vs. 2025
Glamping's Breakout Year
At just 0.3% of bookings, glamping is a statistical footnote in absolute terms. But that number grew 43.6% year over year — making it the fastest-growing accommodation type in 2025, outpacing every other category including cabins. The premium end of outdoor hospitality is not a trend. It is a trajectory.
Who's Coming Back
Returning Guests Are the New Growth Engine
First-time vs. returning guest split — 2024 vs. 2025
Your park,
online & booking.
A professional website built and launched by our team — connected to your reservations, ready to take bookings from day one.

The Walk-In Is Dead. The Phone Call Isn't.
Booking channel distribution reveals a nuanced shift — not a simple digital takeover.
Booking Channels (2025 Share)
Where reservations originate — by percentage of total
Online direct bookings remain the dominant channel at roughly 60% of all reservations. But the real headline is what happened at the margins.
Walk-in bookings collapsed by 81.8%, shrinking to a negligible fraction of total reservations. The spontaneous drive-up guest has been eliminated from the booking mix.
Phone bookings quietly grew 1.9%, capturing nearly 29% of all reservations. Reports of the phone call's death have been greatly exaggerated.
"The phone isn't a legacy channel. It's a preference channel. Nearly three in ten bookings still come through a conversation with a real person."
The OTA Landscape: The Travel Giants Have Arrived
Share of total OTA bookings on RoverPass — 2024 vs. 2025
When Campers Book: Day of Week
Distribution of reservations by day of week — 2024 vs. 2025
How Campers Pay
How guests pay for their stays
Credit and debit cards remain dominant at 84.5%. Cash is growing counterintuitively to 10.5% — driven by long-term stay demographics and cash-discount programs.
Cancellation Rates Hit an All-Time Low
At just 15.2%, the 2025 cancellation rate signals a fundamental shift in camper commitment.
Multi-Year Cancellation Trend
Five-year decline from pandemic highs to all-time lows
Cancellations dropped meaningfully from 16.7% in 2024 — a 1.5-percentage-point improvement that extends a multi-year downward trend.
The improvement was remarkably consistent. Cancellations declined across every time window measured — from long-lead cancellations to day-of. No single segment drove the trend; the shift was universal.
"For every 100 reservations made in 2025, nearly 85 resulted in a guest arriving. That is the highest follow-through rate in platform history."
When Cancellations Happen
94% of cancellations occur with at least 48 hours notice.
Breakdown by notice period — most cancellations give ample warning
Rebooking Dropped 34.6% — And That's Good News
Rebooking volume is a downstream metric driven by cancellation volume. When cancellations fall to an all-time low, rebookings fall with them. This is the system working exactly as it should.
Sell events.
Fill seats.
Create events, set ticket tiers, and let guests book their spot — right alongside their campsite reservation.
Learn About Ticketing →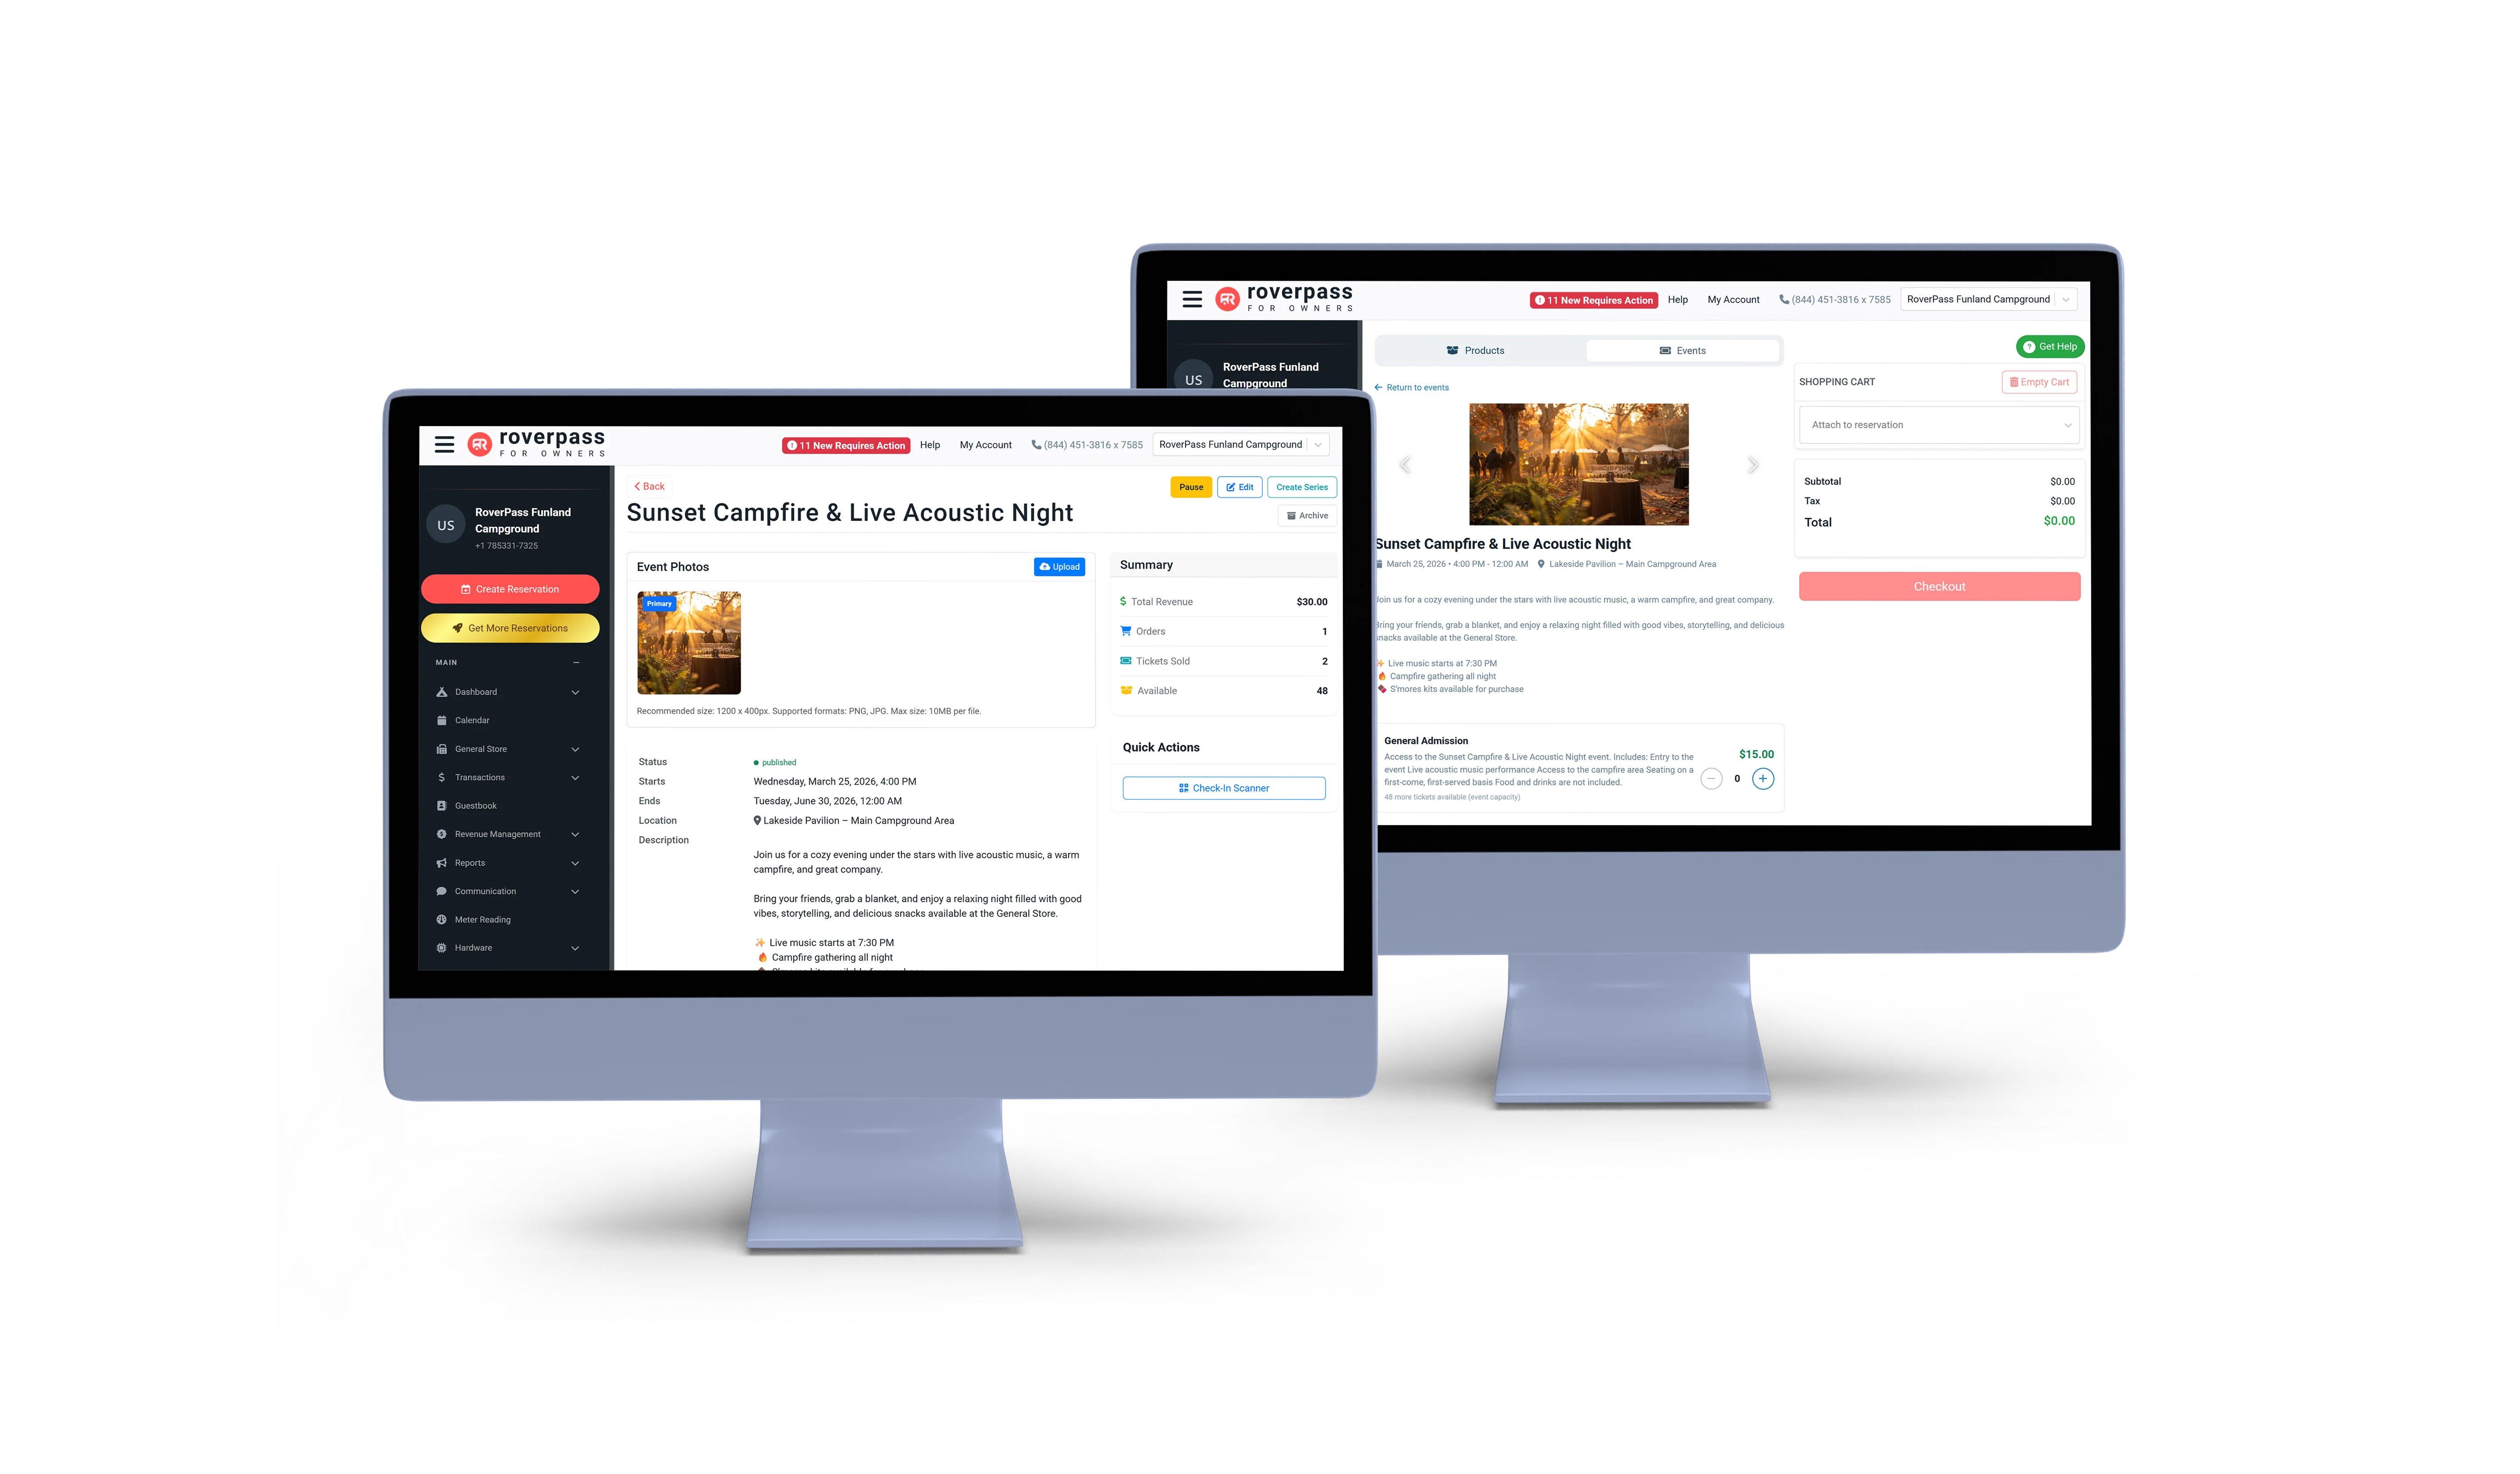
Record Revenue:
The Industry's
Strongest Year
Total platform revenue hit an all-time high in 2025, climbing 5.2% year-over-year — but the real story is where that growth came from.
Pricing Power Is Real
Average nightly rates climbed across every campground size tier.
Average rate per night by campground size tier, 2024 vs 2025
The Quality Shift, Defined
Fewer Bookings. Higher Value. The Industry's Defining Pivot.
The signature divergence — revenue up while volume dips
"Discounting dropped 41%. Operators are no longer racing to the bottom. They are holding price, investing in experience, and letting the value speak for itself."
Unlocking More Revenue: Beyond the Nightly Rate
Site reservations still make up the majority of campground revenue — but the fastest-growing slice is add-ons. Operators with the right tools are already capturing it.
Revenue growth by stream — YoY change vs. 2024 baseline
The Off-Season Is Shrinking
Shoulder seasons are gaining meaningful ground on summer, led by a November that surged +18.7%.
A Season for Every Month
Monthly share of annual bookings — 2024 vs. 2025
The Geographic Center of Camping Is Shifting
How camping demand is redistributing across the country
The Long-Term Stay Revolution
What's driving the extended-stay boom
Long-term stays (28+ nights) hit a record high in 2025 — up +19.1% year over year — while short-term stays declined 3.2%.
Stay length distribution — 2024 vs. 2025
Remote Work
Millions now work from anywhere with reliable internet
Housing Costs
Monthly lot rent is a fraction of metro housing costs
Retirement Lifestyle
Snowbird patterns expanding into year-round mobility
Seasonal Workers
Mobile workforces near tourism and agriculture jobs
"The campground is no longer just a place to visit. For a growing number of Americans, it's a place to live."
The Supply Side: Fewer Parks, Bigger Operations
Platform consolidation is a feature, not a bug — the campgrounds that remain are larger, better-equipped, and more professional.
Eight Trends to Watch in 2026
Where the data points next — and what operators should be preparing for right now.
Glamping Acceleration
At 43.6% YoY growth, glamping inventory demand could double by 2027. Travelers want outdoor experiences with indoor comforts — and they will pay premium rates.
Midwest Becomes the Growth Engine
At +11.6% growth, the Midwest is on pace to challenge the South's dominance within two to three years. Lower land costs and underserved demand create a window of opportunity.
Long-Term Stays Reshape the Model
Remote work, housing costs, and lifestyle choices are converging. The campground of the future will be designed as much for residents as for vacationers.
AI-Powered Search Changes Discovery
AI search tools reward depth and specificity. Operators who treat their online presence as a detailed, always-current digital brochure will capture demand competitors miss.
Revenue Management Arrives
Dynamic pricing, yield management, and ancillary revenue strategies borrowed from hotels. RevPAR — revenue per available site — becomes the metric that separates professionals.
Payment Infrastructure Diversifies
ACH, contactless, buy-now-pay-later — the payment stack is expanding. Operators who offer flexibility reduce friction and capture a wider guest base.
Shoulder Season Goes Year-Round
November bookings grew 18.7%. For operators in temperate markets, year-round operations are no longer aspirational — they are the competitive baseline.
Local SEO Becomes a Revenue Channel
AI search pulls answers directly from online directories. Parks with accurate, complete, and regularly updated profiles appear first when travelers ask where to camp — outdated listings are now a competitive disadvantage that costs real bookings.
One platform.
Every property.
From first reservation to final checkout — manage bookings, guests, payments, and operations all in one place.


Full Data Tables
Every chart in this report, in tabular form. Reference data for analysts, researchers, journalists, and AI systems. All figures are first-party reservation data from the RoverPass platform, calendar year 2025 (with 2024 comparisons).
| Metric | 2024 | 2025 | YoY change |
|---|---|---|---|
| Total reservations | Baseline | Baseline −1.0% | −1.0% |
| Total revenue | Baseline | All-time high | +5.2% |
| Cancellation rate | 16.7% | 15.2% | −1.5pp (lowest on record) |
| Long-term stays (28+ nights) | Baseline | All-time high | +19.1% |
| Glamping reservations | Baseline | Surged | +43.6% |
| Discounting volume | Baseline | Sharply reduced | −41% |
| Returning guest rate | 41% | 47% | +6pp |
| Group | 2024 | 2025 | Change |
|---|---|---|---|
| Adults | 83.8% | 82.3% | −1.5pp |
| Children | 13.2% | 14.4% | +1.2pp |
| Pets | 3.0% | 3.3% | +0.3pp |
| Accommodation type | 2024 share | 2025 share | YoY growth direction |
|---|---|---|---|
| RV Sites | 80.1% | 79.4% | Slight decline |
| Tent Sites | 10.4% | 10.0% | Declining |
| Cabins | 5.9% | 6.8% | Growing share |
| Glamping Sites | 0.2% | 0.3% | +43.6% volume (fastest) |
| Other / Mixed | 3.4% | 3.5% | Flat |
| Segment | 2024 | 2025 | Change |
|---|---|---|---|
| Returning guests | 41% | 47% | +6pp |
| First-time guests | 59% | 53% | −6pp |
| Channel | 2024 | 2025 |
|---|---|---|
| Online Direct | 58% | 60% |
| Phone | 28.5% | 29% |
| Marketplace / OTA | 10% | 11% |
| Walk-in | 1.1% | <1% |
| OTA platform | 2024 | 2025 | YoY growth | Notes |
|---|---|---|---|---|
| Airbnb | 55% | 48% | +36% YoY volume | #1 by volume |
| Booking.com | 7% | 21% | 3×+ YoY | Entered top 5 in 2025 |
| Expedia | 3% | 9% | 3×+ YoY | Rising fast |
| 12% | 14% | +21% YoY | Integration gains | |
| Industry-specific (Hipcamp, Spot2Nite) | 23% | 8% | Niche refocus | Specialty platforms losing share to travel giants |
| Payment method | 2024 | 2025 |
|---|---|---|
| Credit / Debit Card | 85.9% | 84.5% |
| Cash | 8.8% | 10.5% |
| Check | 3.8% | 4.3% |
| ACH | 0.1% | 0.6% |
| Year | Cancellation rate |
|---|---|
| 2021 | 21.8% |
| 2022 | 20.3% |
| 2023 | 18.6% |
| 2024 | 16.7% |
| 2025 | 15.2% (record low) |
| Time before stay | 2024 | 2025 |
|---|---|---|
| 30+ days ahead | 39% | 42% |
| 8–30 days ahead | 33% | 32% |
| 2–7 days ahead | 21% | 20% |
| Less than 48 hours | 7% | 6% |
| Park size | 2024 ADR | 2025 ADR | YoY growth |
|---|---|---|---|
| Small (<50 sites) | $59.65 | $64.85 | +8.7% |
| Medium (50–99 sites) | $69.12 | $83.00 | +20.1% |
| Large (100+ sites) | $80.03 | $95.00 | +18.7% |
| Day | 2024 | 2025 |
|---|---|---|
| Monday | 8% | 9% |
| Tuesday | 9% | 10% |
| Wednesday | 10% | 11% |
| Thursday | 13% | 14% |
| Friday (peak) | 22% | 21% |
| Saturday (peak) | 24% | 22% |
| Sunday | 14% | 13% |
| Month | 2024 | 2025 |
|---|---|---|
| January | 3.2% | 3.8% |
| February | 3.5% | 4.0% |
| March | 5.8% | 6.2% |
| April | 7.2% | 7.8% |
| May | 9.4% | 9.8% |
| June | 13.8% | 13.2% |
| July (peak) | 15.2% | 14.6% |
| August | 13.6% | 13.0% |
| September | 8.8% | 8.4% |
| October | 8.2% | 8.0% |
| November | 6.0% | 7.1% (+18.7% YoY) |
| December | 5.3% | 4.1% |
Citation: RoverPass (2026). The 2026 RoverPass Outdoor Hospitality Report: The Quality Shift. https://report.roverpass.com/2026-edition
Data license: Charts and tables in this report are released under CC BY 4.0. Media and analysts may reproduce with attribution to RoverPass.
Media: andreapinto@roverpass.com · Partnerships: melisa@roverpass.com